
See Where the Money Goes with Procurement Analytics
Your purchasing data already holds the answers: total spend, savings, price creep, supplier risk. AI reads it on live ERP data and gives you the number, so you stop guessing and stop pulling reports by hand.
50+ ERP and software projects. Zero failed projects since 2021.
Your spend data is there, but nobody can see it
The purchase orders, invoices and contracts already sit in your ERP. The problem is turning them into a number you can act on before the money is gone.
One clear view of where every rupee goes
Spend is spread across departments, categories and suppliers, so no one sees the whole picture. AI pulls it together and shows total spend broken down by category and supplier, in one place, on live data.
- Total spend at a glance, not in ten reports.
- Spend by category and by supplier.
- Live, so it matches what your ERP shows today.

Find the savings and the money quietly leaking out
Prices creep up, buying goes around agreed suppliers, and small overpayments add up. AI watches for it and shows the savings you have captured and the leakage still worth chasing.
- Savings captured against agreed prices.
- Maverick spend that went off-contract.
- Price creep flagged supplier by supplier.
The difference procurement analytics makes
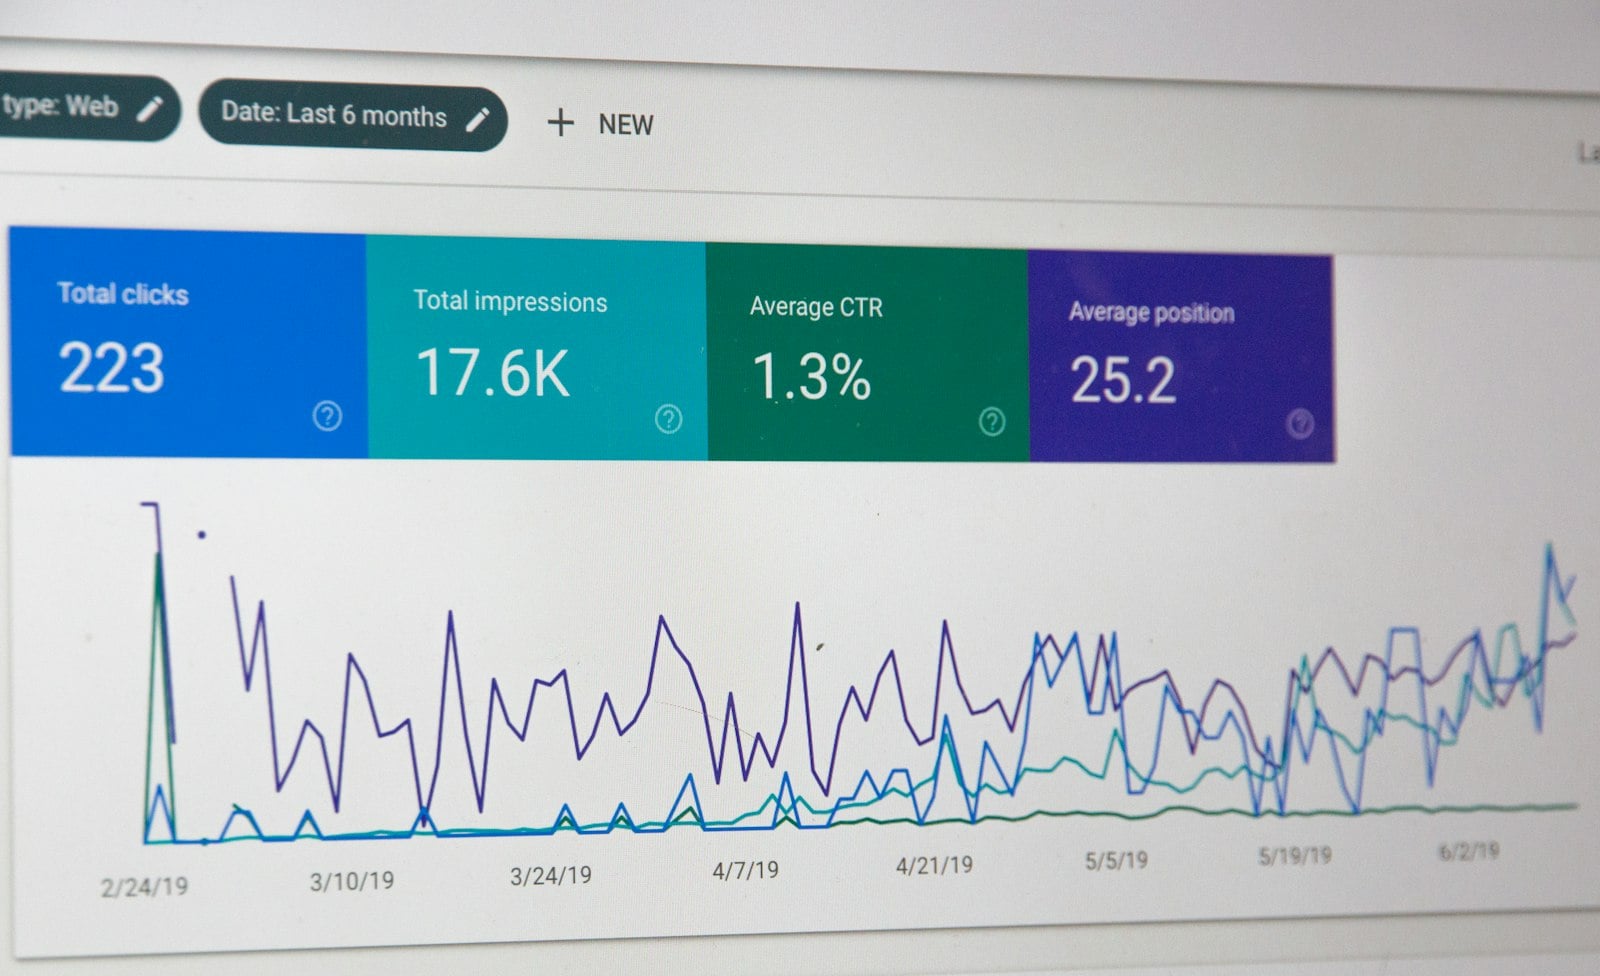
Same data, same suppliers. One side pulls reports by hand and finds out too late. The other side sees it on live data.
- Reports take days and are out of date by the time they land.
- Spend sits in separate sheets, so no one sees the total.
- Price rises are noticed only after the invoices are paid.
- Off-contract buying stays hidden until year end.
- Every question means a new report request.
- Numbers update with your ERP, so they are current.
- Total spend, by category and supplier, in one view.
- Price creep is flagged as it starts, not after.
- Maverick spend shows up the moment it happens.
- Anyone can ask a question and get the number.
From your ERP data to a number you can act on
Six things you can watch on live data
Each one reads your ERP purchasing data, so the number matches what is really happening.
Total spend
One running number for how much you are spending, with the trend over time, not a stale monthly figure.
Spend by category and supplier
See exactly where the money goes, which categories are growing, and which suppliers take the biggest share.
Savings and leakage
Savings captured against agreed prices, and the leakage, like maverick spend and small overpayments, still worth chasing.
Contract compliance
How much buying happens on agreed contracts versus off-contract, so you can pull spend back where it belongs.
Supplier performance
Track each supplier on price, on-time delivery and reliability, so renewals and negotiations sit on real numbers.
Risk flags
Price creep, maverick spend and concentration risk where too much sits with one vendor, flagged before it bites.
What procurement analytics changes
Why teams choose TCB Infotech for procurement analytics
Procurement analytics questions
What is procurement analytics?
Where does the data come from?
Do we have to change our ERP?
Can my team ask questions in plain language?
What does it flag on its own?
Is this model-agnostic?
See Where Your Spend Really Goes
Book a free consultation. We will look at your ERP purchasing data and show you what procurement analytics would surface for your business.
Book a Free Consultation →No commitment. A practical first look at your spend data.
What Is Inside Procurement Analytics
It reads the purchasing data already in your ERP and turns it into numbers you can act on. Here is what it tracks, what it flags, and how your team gets the answer.
From live ERP data to answers your team can use
Every category and supplier in one view
Spend no longer hides across departments and spreadsheets. You get total spend broken down by category and by supplier, with the trend over time, all on live ERP data so it matches what is really happening.
- Total spend with the trend over time.
- Spend by category and by supplier.
- Live numbers, not a month-old export.
The savings you captured and the money leaking out
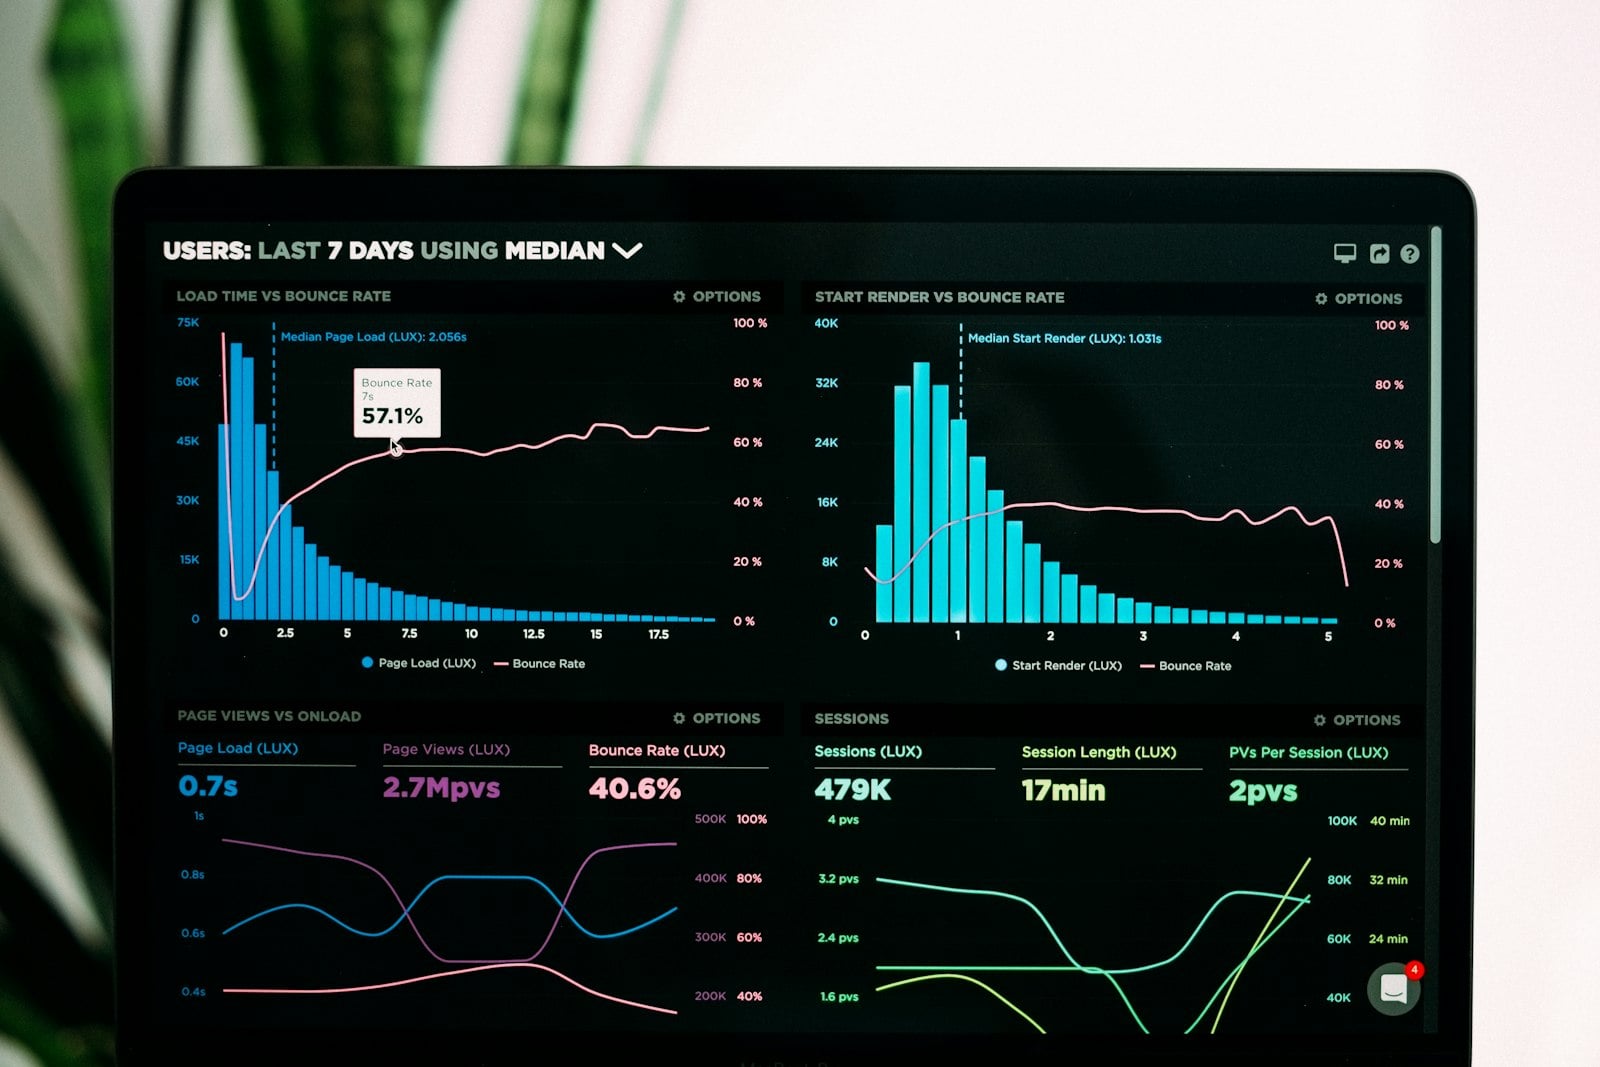
It tracks savings against agreed prices and flags the leakage worth chasing: maverick spend that went off-contract, price creep where a supplier keeps nudging rates up, and small overpayments that add up quietly.
- Savings captured against agreed prices.
- Maverick and off-contract spend surfaced.
- Price creep flagged supplier by supplier.

Type a question, get the number
Anyone on the team can ask how much they spent on packaging last quarter, or which supplier raised prices the most, and get the answer with the detail behind it. No report request, no waiting on someone else.
- Plain-language questions, no query language.
- The number plus the detail behind it.
- Supplier performance and risk on demand.

Everything procurement analytics tracks
Total spend view
One running number for total spend, with the trend, so you always know where you stand.
Category and supplier breakdown
See which categories grow and which suppliers take the biggest share of your spend.
Savings and leakage
Savings captured against agreed prices, and the leakage still worth chasing.
Contract compliance
How much buying stays on agreed contracts, so you can pull spend back on-contract.
Supplier performance
Each supplier on price, delivery and reliability, ready for renewals and negotiations.
Risk flags
Price creep, maverick spend and concentration risk, flagged before they cost you.