
TCB Infotech | Expert Odoo & ERPNext Implementation Partner


Schedule Call With Us
AI Manufacturing Automation

See the Hidden Capacity in the Machines You Already Own

Most plants do not have a machine problem. They have a visibility problem. Machine utilization analytics shows how well each machine is actually used, so you move work to idle capacity instead of buying more.

50+ ERP and software projects. Zero failed projects since 2021.

Machine utilization
Live
68%
average across the line
CNC 1
82%
CNC 2
74%
Press A
66%
Lathe 3
42%
Grinder
71%
Illustrative figures. Lathe 3 is flagged for wasted capacity.
Per machine
True utilization
Idle + setup
Broken down
Shift by shift
Compared side by side
Hidden
Capacity found
Why It Matters

You are probably running more machines than you need

When no one can see true utilization, idle time hides in plain sight and the answer to every capacity question is to buy another machine.

The Real Picture

A machine can look busy and still sit idle half the shift

A machine that is switched on is not the same as a machine that is cutting parts. Between changeovers, waiting for material, and small stops, a lot of available time disappears. Utilization analytics separates real running time from the rest, so you see how much capacity is actually being used.

  • Running time measured against available time.
  • Idle, setup and downtime pulled apart.
  • The true utilization figure per machine.
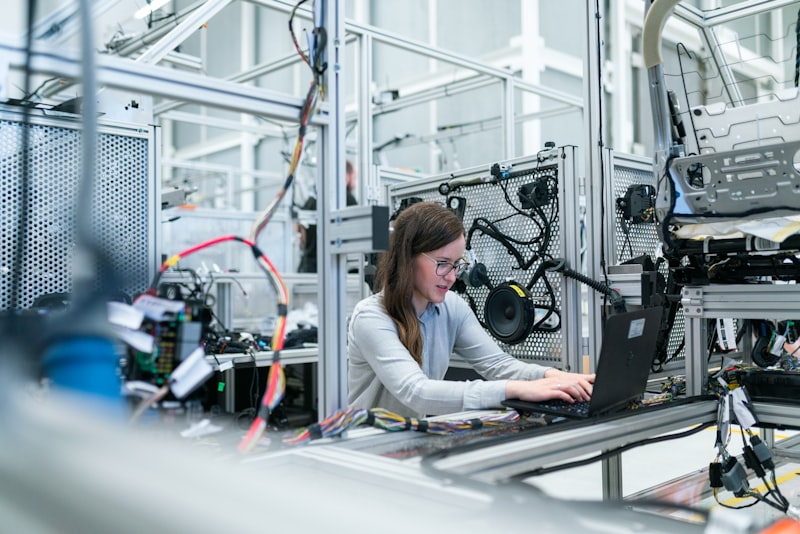
A manager reviewing machine utilization on a plant floor
Capacity You Already Own

Find capacity before you spend on another machine

When one machine is flat out and another sits at 42%, the fix is usually to move work, not to buy. The service compares machines and shifts and flags where capacity is wasted, so you can rebalance the load and get more out of the machines that are already on the floor.

  • Busy machines compared with idle ones.
  • Wasted capacity flagged clearly.
  • A case for rebalancing before buying.
Machines on a factory line running at different loads
What You See

Every machine, every shift, in one view

Instead of one plant-wide number, you get utilization per machine, with the low performers flagged so managers know where to act first.

Utilization by machine, day shift
Live
64%
shift average
Injection 1
88%
Injection 2
61%
Assembly A
73%
Assembly B
39%
Packing
69%
Illustrative figures. Assembly B is flagged for wasted capacity on this shift.
How It Works

From machine signals to a decision you can act on

1
Connect data
We pull run and stop signals, production orders and shift plans from your machines and ERP.
2
Define available time
We set what each machine was actually available to run, per shift and per day.
3
Split the time
AI separates running time from idle, setup and downtime, with reasons where known.
4
Compare
Machines and shifts are compared side by side, and wasted capacity is flagged.
5
Act
Managers see the real picture, rebalance work, and track whether utilization improves.
What It Measures

The numbers that show where capacity goes

Each measure turns a vague sense that machines are busy into a figure you can question and improve.

📈

True utilization per machine

Running time against available time for each machine, so you see how much of the day is really productive.

Idle time

The time a machine was available but not running, separated out so it stops hiding inside the total.

🔧

Setup and changeover

How much time goes into changeovers and setup, so you can see where quick changes would free up hours.

🛑

Downtime and reasons

Real stoppages and, where recorded, why they happened, so repeat losses become easy to spot.

🕑

Shift comparison

The same machine across day and night shifts, so gaps between teams and patterns become visible.

🚩

Wasted capacity flags

The machines and shifts running well below the rest, flagged so managers know where to look first.

What Changes

What a clear view of utilization gives you

True
Utilization per machine
Hidden
Capacity brought into view
Fewer
Machines bought too soon
Balanced
Work across the floor
Clear
Idle and setup losses
Better
Use of what you own
Why Us

Why manufacturers choose TCB Infotech

1
We know the data
We build ERP and software, so we work with your real machine and production data, not a demo.
2
Plant first
We start on the floor, with how your machines and shifts actually run, then bring in the AI.
3
Honest numbers
The figures are yours to question. If a signal is weak, we say so and show how to firm it up.
4
Model-agnostic
We pick the approach that fits your data instead of tying you to one AI model or vendor.
5
Practical output
Managers get a view they act on, not a dashboard that no one opens after week one.
6
Proven delivery
50+ projects across industries, with zero failed projects since 2021.
FAQ

Machine utilization analytics questions

What is machine utilization analytics?
It is an AI service that measures how well each machine is actually used. It compares running time against the time each machine was available, then breaks the rest down into idle, setup and downtime so you can see where capacity is wasted.
How is this different from just reading machine hours?
Raw machine hours do not tell you what good looks like. The service compares running time to available time, separates setup and idle from real downtime, and compares machines and shifts, so you see true utilization instead of a single number.
Where does the data come from?
It uses the machine and ERP data you already have, such as run and stop signals, production orders, shift plans and downtime reasons. We work with what your machines and systems already record.
Will this help us avoid buying another machine?
Often yes. Many plants run new machines while older ones sit idle for part of every shift. When you can see the real utilization per machine, you can move work around and use the capacity you already own before spending on more.
Do we need new sensors on every machine?
Not always. Many machines already produce run and stop signals, and a lot can be reconstructed from ERP and production data. Where a signal is missing we advise the simplest way to capture it, without a full rebuild.
Is this tied to one AI model or vendor?
No. The service is model-agnostic. We choose the approach that fits your data and keep the plan yours, so you are not locked to a single model or vendor.

See How Well Your Machines Are Really Used

Book a free consultation. We will look at your machine and ERP data and show what machine utilization analytics would reveal about the capacity you already own.

Book a Free Consultation →

No commitment. A practical first look at your utilization.