
See Problems Before Your Users Do
Centralized metrics, dashboards, alerting thresholds and log aggregation for your applications and infrastructure, so issues are caught before anyone has to report them.
50+ ERP and software projects. Zero failed projects since 2021.
Finding out from a customer is the most expensive way to find out
Without centralized metrics and logs, most teams learn about a problem only after someone outside the team notices it first.
Alerts fire on the trend, not just the outage
Thresholds are set against your system's normal range, so a slow climb in latency or error rate triggers an alert well before it turns into downtime.
- Alerts tuned to your baseline, not generic defaults.
- Routed to the right channel or on-call tool.
- Reviewed and adjusted over the first few weeks.

Logs aggregated instead of scattered across servers
Application and infrastructure logs are pulled into one searchable place, so diagnosing an issue does not start with logging into individual machines one by one.
- Centralized, searchable log aggregation.
- Metrics and logs viewed side by side.
- Faster diagnosis when something does go wrong.

Metrics, status and thresholds at a glance
Illustrative example. Your actual dashboard depends on the metrics that matter for your systems.
From current blind spots to a tuned alerting setup
Everything needed to see and respond to issues early
Centralized dashboards
Metrics from applications and infrastructure shown together in one place.
Tuned alert thresholds
Thresholds set against your systems' own baseline, then adjusted over time.
Log aggregation
Application and infrastructure logs pulled into one searchable location.
Alert routing
Alerts routed to the right channel or on-call tool based on severity.
Trend visibility
Historical trends make it easy to see when a system is slowly drifting off baseline.
Connects to your stack
Set up against your existing tools, and can connect to your ERP or CRM environments where relevant.
What Monitoring & Logging changes for your team
Why teams choose TCB Infotech for Monitoring & Logging
Monitoring & Logging, answered
What does a Monitoring and Logging setup include?
Which tools do you set this up with?
How are alert thresholds decided?
Will this reduce alert fatigue?
Do you set up on-call rotations too?
How long does setup take?
Start Seeing Issues Before Users Do
A dashboard that shows what is actually going on beats waiting for a support ticket. Book a free consultation and tell us what you are trying to catch earlier.
Book a Free Consultation →No commitment. Start with the metrics that matter most.
How Monitoring & Logging Works
From identifying what actually needs watching to a dashboard and alert setup your team can trust. Here is how we build it.
Mapping, collecting and tuning, in that order
Deciding what is actually worth watching
We start by identifying the metrics and log sources that reflect real user impact, rather than instrumenting everything and sorting it out later.
- Metrics tied to real user impact.
- Log sources prioritized by relevance.
- A short list before a long build.
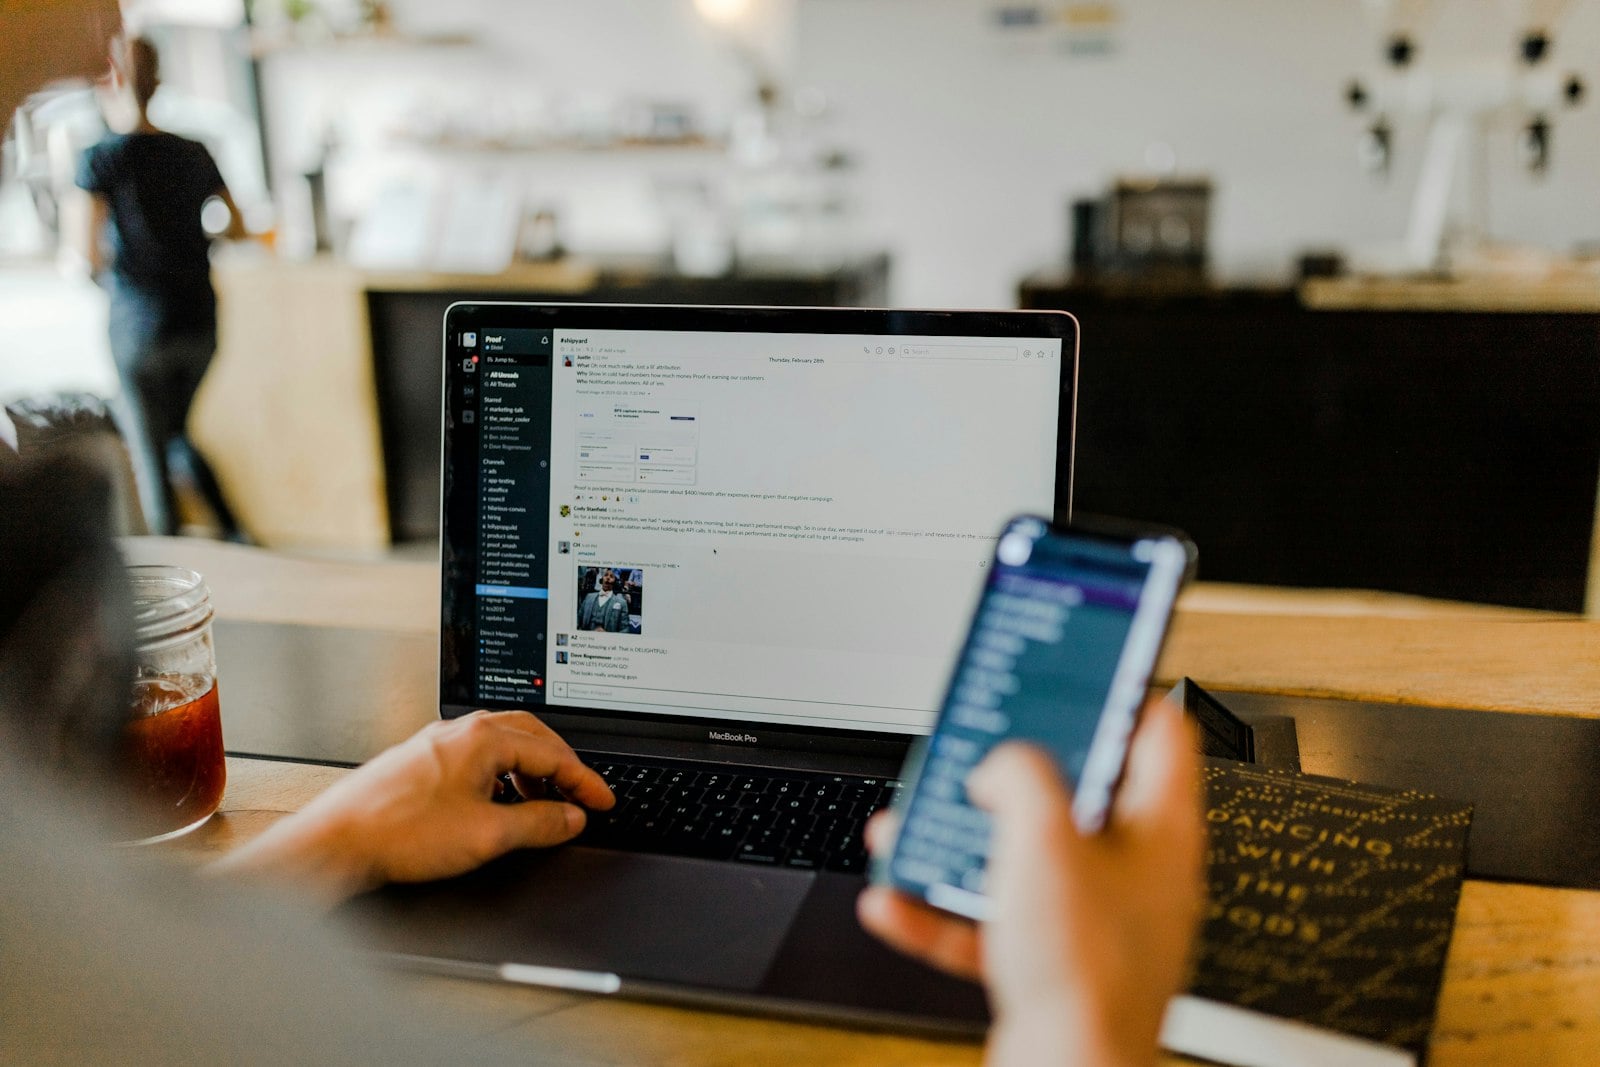
Metrics and logs pulled into one view
Collection agents and log shippers feed a central system, and dashboards are laid out around how your team actually needs to check on things day to day.
- Metrics and logs in one place.
- Dashboards built around real workflows.
- Historical trends kept, not just current state.
Alerts adjusted until they are actually useful
Thresholds are reviewed with your team over the first weeks, moving noisy alerts to a dashboard and keeping pages for what genuinely needs a response.
- Thresholds reviewed with your team.
- Noisy alerts demoted, not deleted.
- Routing checked against your on-call tool.

Everything included in the engagement
Centralized dashboards
Metrics from applications and infrastructure shown together.
Tuned alert thresholds
Thresholds set against your systems' own baseline.
Log aggregation
Logs pulled into one searchable location.
Alert routing
Alerts routed by severity to the right channel.
Trend visibility
Historical trends surface slow drift early.
Connects to your stack
Set up against the tools you already run.