

Three People, Three Revenue Figures, One Wasted Meeting
That is a definition problem, not a chart problem. We build a reporting layer over your ERP with the metrics written down and agreed, then connect your BI tool to it, so every dashboard is answering the same question the same way.
50+ ERP and software projects. Zero failed projects since 2021.
A dashboard nobody trusts is worse than no dashboard
People go back to their own spreadsheets, and now you are paying for a BI licence as well as the spreadsheets.
Decide what revenue means before you plot it
Revenue can mean ordered, delivered, invoiced or collected. Margin can be before or after landed cost, freight and discount. Until those choices are written down and agreed, two correct reports will disagree and everyone will blame the tool. We settle definitions first and build from them.
- A written definition for every metric on a dashboard.
- Agreed by the people who will argue about it later.
- Charts built from the definitions, not the other way round.

Reporting should never slow down invoicing
Letting a BI tool query your live transactional database directly means one heavy report can make the system crawl for everyone raising orders. We extract to a separate reporting layer on a schedule, which protects performance and lets us keep history the ERP overwrites, such as what a price or a cost was last quarter.
- Extracted to a reporting layer on a schedule.
- Operational performance protected from heavy queries.
- History retained that the ERP itself overwrites.

What the reporting setup covers
Scoped to the decisions you actually make, not to every field the ERP happens to hold.
From the questions to dashboards people use
What every build ships with
Metric dictionary
Definitions, filters and owners for every figure that appears on a dashboard.
Modelled data layer
Documented tables and relationships, kept tool-neutral so BI products can change.
Refresh schedule
Per dataset, with monitoring and an alert when a refresh fails or runs long.
Tie-back testing
Dashboard figures reconciled against ERP reports before anyone is asked to trust them.
Access rules
Row and column level restrictions mapped to roles and documented.
Handover pack
Model documentation and guidance so your team can extend it without us.
What a proper reporting layer changes
Why teams choose TCB Infotech for BI integration
BI and analytics integration questions
Why do our reports disagree with each other?
Should we report inside the ERP or use a separate BI tool?
Will heavy reporting slow down the ERP?
How current is the data in the dashboards?
Which BI tools can you connect to?
How long does a BI integration take?
Get Reporting Everyone Agrees With
Book a free consultation. Tell us which numbers get argued about in your management meeting, and we will show you where the definitions are pulling apart.
Book a Free Consultation →No commitment. A practical look at your reporting and where it disagrees.
What Is Inside a BI and Analytics Integration
Charts are the last thing we build. Here is the work underneath them: the definitions, the data model, the refresh schedule, and the testing that makes the numbers safe to act on.
From a written definition to a dashboard that ties back
The document that stops the arguments
For every figure that will appear on a dashboard we record what it counts, what it excludes, which date it uses, and who owns the definition. Exclusions matter more than people expect: whether debtor days counts disputed invoices, or whether margin is before or after freight, changes the answer materially.
- Plain-language definition per metric, with its filters.
- A named owner for each figure.
- Exclusions recorded explicitly, not left implied.
Shaped for questions, not for transactions
ERP tables are built to record work efficiently, which makes them awkward to query for analysis. We model an extract shaped around the questions you ask, refreshed on a schedule that matches the decision, and hold history the ERP itself overwrites so you can still answer what a cost or a price was last quarter.
- A documented model, kept tool-neutral.
- Refresh cadence chosen per dataset, with failure alerts.
- Point-in-time history the ERP does not retain.
Different views, restricted properly, reconciled first
Each role gets a view of what it can act on, with row-level and column-level rules so a branch manager sees their own numbers rather than everyone else's. Before anyone is asked to trust a dashboard we reconcile its figures against the equivalent ERP report, line by line, and record that it ties.
- Role-based views built around real decisions.
- Row and column level access rules, documented.
- Every figure tied back to an ERP report before launch.
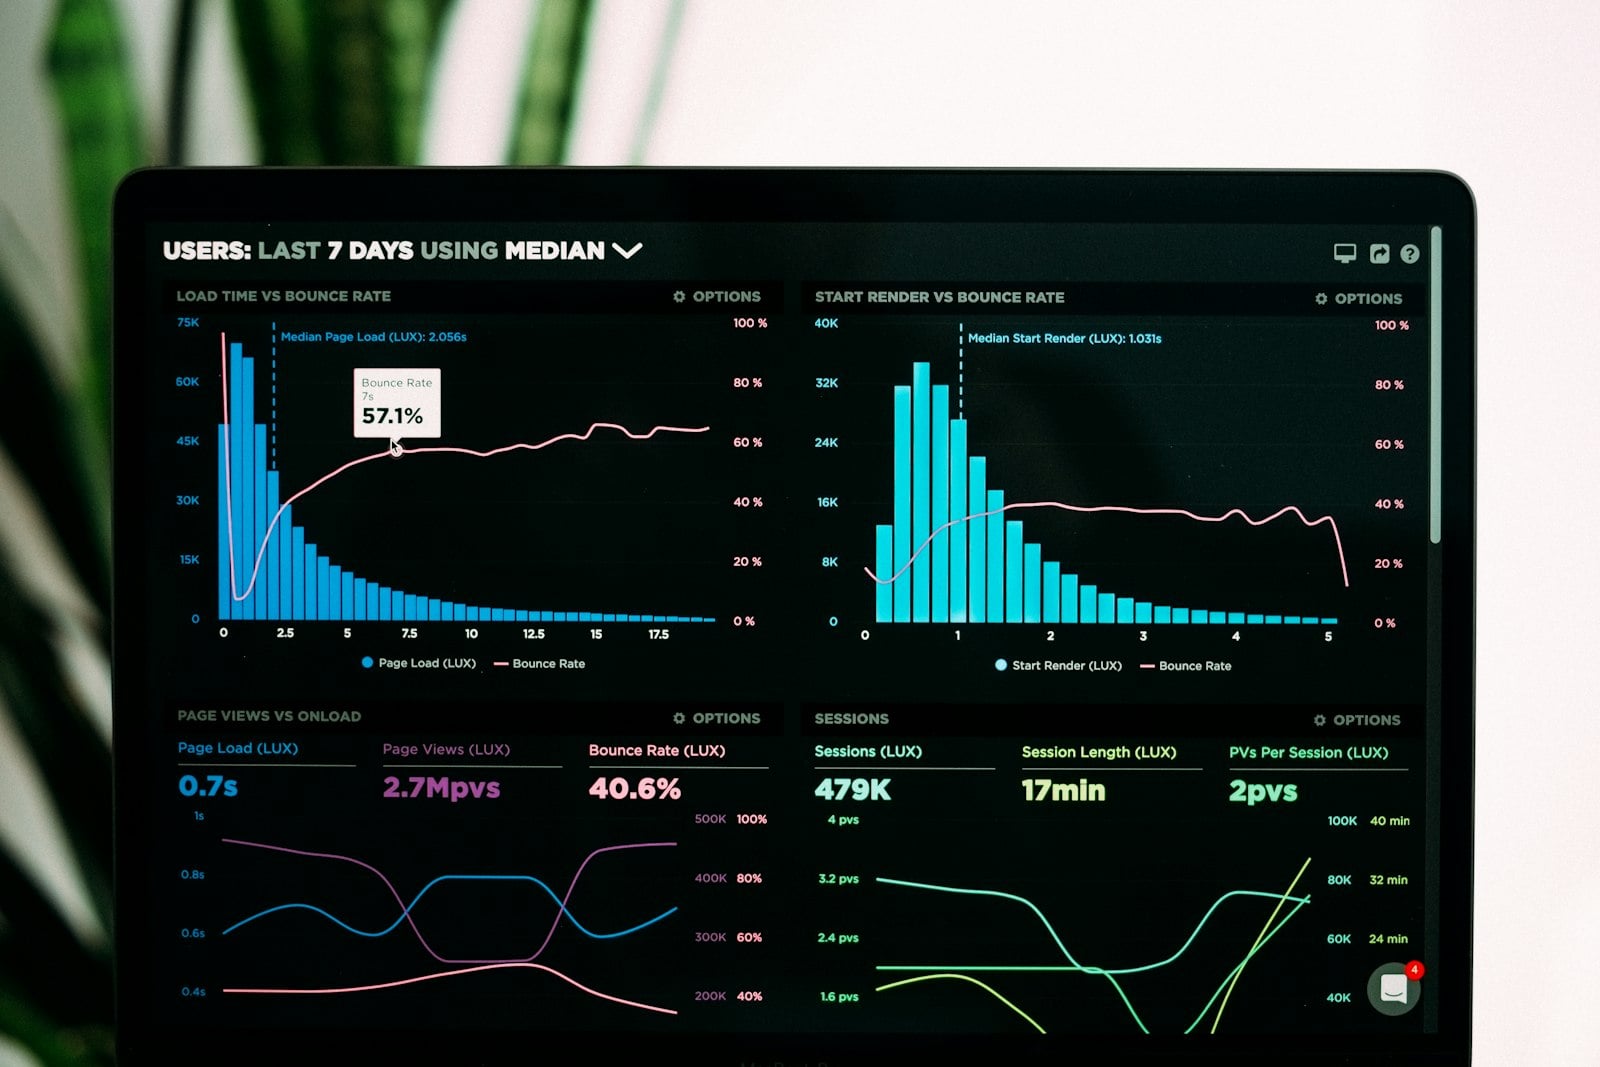
Everything the build delivers
Metric dictionary
Definitions, filters, date basis and owner for every reported figure.
Documented data model
Tables, relationships and transformations written up so your team can extend it.
Monitored refresh
Scheduled loads with alerts when one fails or runs longer than expected.
Tie-back evidence
A record showing each dashboard figure reconciled against the ERP equivalent.
Access matrix
Who sees which rows and columns, mapped to roles and reviewable.
Handover and training
A session per role, so dashboards get used rather than opened once.