TCB Infotech | Expert Odoo & ERPNext Implementation Partner


Schedule Call With Us
AI Performance Analytics

Give Managers the Evidence for Fair, Useful Reviews

Review season should not run on memory. Our AI pulls goals, output, attendance and feedback into one clear picture, tracks progress against targets, and shows managers where each person stands. The manager makes the call.

50+ ERP and software projects. Zero failed projects since 2021.

Performance, this quarter
Priya S. · Sales · Q3 review window
AI
A- Overall rating, drawn from the metrics below
Goals met8 of 10
Output vs target92%
Quality of work76%
Attendance97%
vs last quarter +6% Illustrative figures
1
Place for all performance data
4+
Signals pulled together
Every
Team seen the same way
You
Make the final call
Why It Matters

Fair reviews come from evidence, not memory

When performance data sits in different tools and reviews lean on the last few weeks, good work gets missed and ratings drift. Putting the whole picture in one view fixes that.

One Clear Picture

Performance data in one place, not five tabs

Goals live in one tool, output in another, attendance somewhere else, and feedback in email. The AI brings it together for each person and each team, so a manager sees the full period at a glance instead of stitching it together by hand.

  • Goals, output, attendance and feedback in one view.
  • The full review period, not just the recent weeks.
  • Less time gathering data, more time on the conversation.
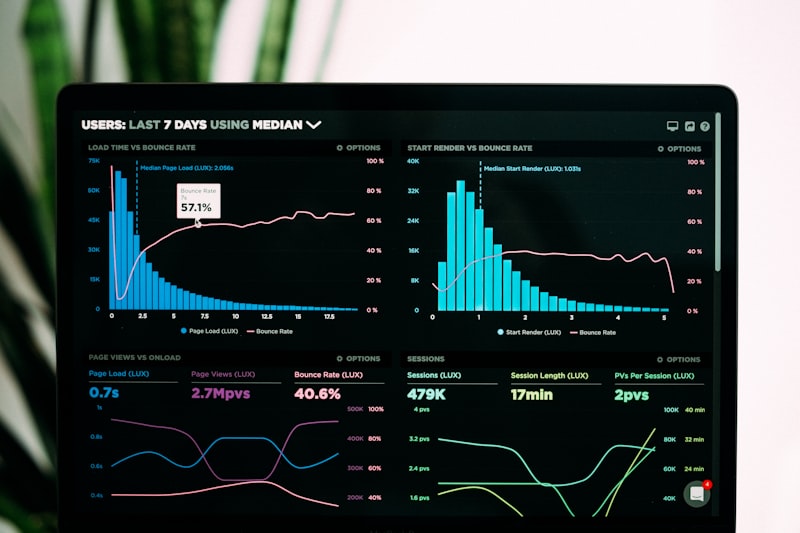
A manager reviewing performance data on a dashboard
The Manager Decides

The AI informs, it does not rate people

The tool organises the evidence and points out patterns worth a closer look. It does not hand out a final score for a person. The manager reads the picture, adds the context only they know, and makes the call.

  • Evidence and trends surfaced, clearly labelled.
  • Context and judgement stay with the manager.
  • A fairer, better prepared conversation, both ways.
A manager and team member in a review conversation
The Evidence, Read at a Glance

What a team view looks like

The same metric rows roll up to a team, so a manager can see where the group is strong, where it is stretched, and who might need support. Figures below are illustrative.

Team goals on track78%
Output vs plan88%
People meeting targets9 of 12
Feedback captured this cycle94%
How It Works

From scattered records to a clear review, in five steps

1
Connect
We link your HR, goal, output and attendance systems, using the sources you already run.
2
Bring together
The AI pulls each person's goals, work, attendance and feedback into one profile.
3
Track
Progress is measured against targets across the review period, not just recent weeks.
4
Surface
Top performers, support needs and team trends are highlighted for the manager to read.
5
Decide
The manager reviews the evidence, adds context, and makes the final call.
What It Measures

The signals behind a fair picture

It reads from your own HR and performance data, so the picture matches how your business already runs.

🎯

Progress against goals

How each person is tracking against the goals and targets set for the period, updated as work lands.

📈

Output and delivery

The volume and pace of completed work, drawn from the tools where the work already gets logged.

📋

Quality and rework

Signals on how work holds up, so consistent quality shows up next to raw output, not instead of it.

📅

Attendance and availability

Presence and leave patterns, shown as context for a manager to read, never as a rating on their own.

💬

Feedback from people

Manager and peer feedback gathered through the cycle, so praise and concerns are not lost by review time.

👥

Trends across teams

How a person compares to their own past and how a team is moving, so patterns are easy to spot.

What Changes

What a clear picture changes at review time

One
Place for all performance data
Whole
Period reviewed, not just recent weeks
Fair
Evidence applied the same across the team
Seen
Top performers and support needs surfaced
Clear
Trends across teams, easy to read
Yours
The final call stays with the manager
Why Us

Why teams choose TCB Infotech for performance analytics

1
We connect your systems
We build HR and ERP systems, so we work with your real data and tools, not a fresh silo.
2
Managers stay in charge
The AI gives evidence and surfaces patterns. People are rated by their manager, not by a model.
3
Fairness built in
The same signals, applied the same way across every team, so reviews are consistent.
4
Model-agnostic
We fit the AI to the job and your data, and stay free to change the model as better ones arrive.
5
Access under control
Your own roles and permissions decide who sees what, so employee data stays private.
6
Proven delivery
50+ projects across industries, with zero failed projects since 2021.
FAQ

Performance analytics questions

What does AI performance analytics actually do?
It pulls your scattered performance data into one place: goals, output, attendance and feedback. It tracks progress against targets, highlights top performers and people who may need support, and shows trends across teams. It gives managers evidence for a review; it does not rate anyone on its own.
Does the AI decide people's ratings or scores?
No. The AI organises the evidence and surfaces patterns so a manager can see the full picture. The manager makes the call. The tool informs the conversation, it does not replace the person having it.
Where does the performance data come from?
From your own HR and performance systems: goal and OKR records, task or project output, attendance and leave, and feedback from managers and peers. We connect to the sources you already use rather than asking you to re-enter data.
How does this make reviews more fair?
Reviews often lean on what a manager remembers from the last few weeks. Putting the full period's evidence in one view means the conversation is based on the whole picture, applied the same way across the team, instead of memory alone.
Is our employee data kept private?
Yes. Access follows your own roles and permissions, so managers see their own teams and HR sees what its policy allows. The data stays inside your systems and is used to support your decisions, not shared out.
Are the numbers on this page real?
No. The figures shown in the scorecard and examples are illustrative, used to show the kind of view a manager would get. Your own dashboard is built from your real data.

Give Your Managers a Fairer Way to Review

Book a free consultation. We will look at where your performance data lives today and show you the kind of clear, fair picture your managers could work from.

Book a Free Consultation →

No commitment. A practical look at your performance data.