TCB Infotech | Expert Odoo & ERPNext Implementation Partner


What Is Inside AI Shop Floor Monitoring
It is a working view of your floor, not another report. Here is what it tracks, how it catches a stop, and how it gets the right person to act.
From a machine signal to a supervisor acting
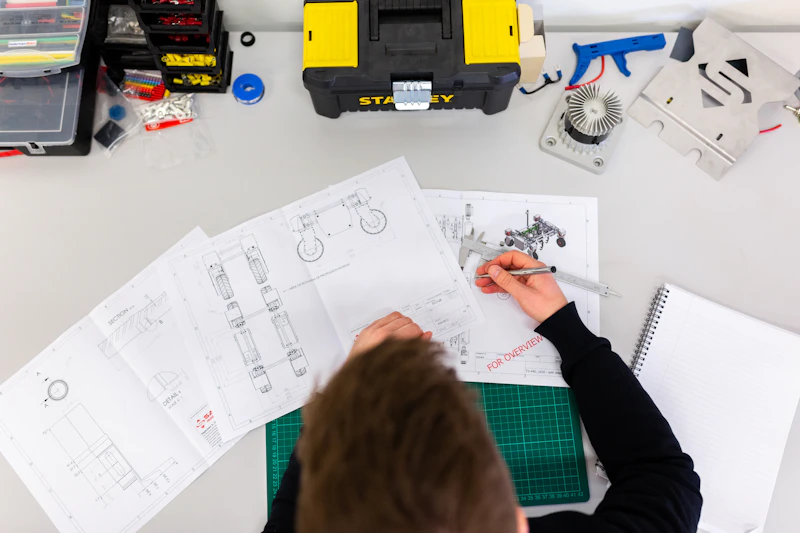
The whole floor on one screen
Every machine shows as running, idle or down, with its output next to the name. The same board runs on a wall screen, an office monitor and a phone, so the floor is visible to everyone who needs it at the same moment.
- Running, idle and down states, updated live.
- Output and pace next to each machine.
- One view on the wall, the desk and the phone.
A stop or a slow line, caught immediately
The moment a machine stops, or drops below the pace it should be holding, it is flagged. A slowdown that a shift report would bury shows up on the board while there is still time to act on it.
- Stops flagged the second they start.
- Slowdowns caught against the normal pace.
- Lost time counted, not estimated later.
The right person told, the reason recorded
Each stop goes to the person who can act, with escalation if it drags on, on the channel they already use. The reason is logged against the stop, so over days and weeks the causes that cost you the most become obvious.
- Alerts routed by line, severity and duration.
- Escalation when a stop is not cleared.
- A reason on every stop, building a record.
Everything the monitoring covers
Live machine status
Running, idle or down for every machine on one board, updated in real time.
Output and pace
Units per hour against target pace, so a slowdown shows before it becomes a shortfall.
Bottleneck view
Where work piles up and which machine holds back the line, so you fix the real constraint.
Alerts and escalation
Notifications routed by line, severity and duration, escalating when a stop is not cleared.
Stop reason log
Every stop tagged with its cause, building the record that shows what to fix first.
ERP-aligned view
Output and downtime reconciled with your work orders, so numbers tie back to the jobs they belong to.
See What a Live Board Would Cover for You
Book a free consultation. We will walk through your lines, the signals your machines send, and your ERP, and scope a monitoring board for your plant.
Book a Free Consultation →