TCB Infotech | Expert Odoo & ERPNext Implementation Partner

What Is Inside AI Demand Forecasting
The forecast is a working number your planners and buyers use every week, not a one-off report. Here is what it predicts, how it shows confidence, and how it reaches the screens your team already works in.
From your sales history to a number you plan on
A predicted demand number for each product and place
Instead of one blanket target, you get a demand figure for every product at every warehouse, store or region. That is the level at which you actually order and hold stock, so the number is one you can act on directly.
- A quantity per SKU, not a category guess.
- Separate numbers per location and channel.
- Short-term and longer-horizon views.

Every number is backed by the signals behind it
The model weighs your past sales, your seasonal peaks and dips, and whether each item is rising or falling. As new sales arrive it updates, so the forecast keeps up with real demand instead of drifting away from it.
- Learns from your own sales history.
- Handles festivals, weather and promotions.
- Adapts as patterns shift over time.

A confidence level, fed into planning and purchasing
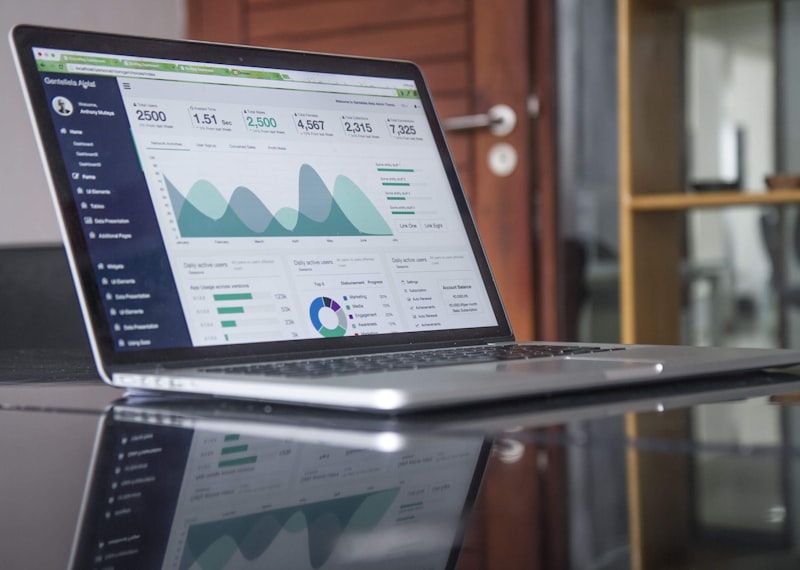
Each forecast shows how sure the model is, so planners trust the strong items and review the weak ones. The numbers flow back into the ERP and planning screens your team uses, so nobody has to re-key a spreadsheet.
- Confidence level on every SKU forecast.
- Low-confidence items flagged for review.
- Numbers delivered into your existing tools.
Everything the forecast delivers
Demand per SKU
A predicted quantity for each product, at the level you order and hold stock.
Per-location split
Separate forecasts for each warehouse, store or region, so stock sits where it sells.
Confidence level
A confidence score on every number, so planners know what to trust and what to review.
Seasonality and trend
Peaks, dips and direction built into each forecast, from your own history.
Adapts over time
The model refreshes as new sales arrive, so the number stays close to real demand.
Fed into your systems
Forecasts delivered into the ERP and planning screens your team already uses.
See What the Forecast Would Cover for You
Book a free consultation. We will walk through your sales history and systems and scope an AI demand forecast for your top products and locations.
Book a Free Consultation →