
TCB Infotech | Expert Odoo & ERPNext Implementation Partner


Schedule Call With Us
OEE Analytics

Know Your OEE Without a Single Spreadsheet

AI calculates OEE, Overall Equipment Effectiveness, straight from your machine and ERP data. It splits the number into Availability, Performance and Quality, tracks it live per machine and line, and shows you exactly what is dragging it down.

50+ ERP and software projects. Zero failed projects since 2021.

OEE, Line 1
Live
72% Overall OEE
Availability88%
Performance91%
Quality90%
Biggest loss: downtime, changeover on Line 1
Figures illustrative
Live
OEE per machine and line
3
Parts: Availability, Performance, Quality
Auto
Calculated from machine data
0
Manual OEE spreadsheets
Why It Matters

A manual OEE number is always late and always argued

By the time OEE is typed into a spreadsheet, the shift is over and the loss is gone. The AI reads the same data live, so the number is current and the same for everyone.

Calculated, Not Typed

OEE straight from the machine, not a clipboard

Run and stop signals, cycle counts and reject records are read automatically, so OEE is calculated the same way every time. No shift-end data entry, no two versions of the truth, no waiting until tomorrow to see what happened today.

  • OEE calculated automatically from machine and ERP data.
  • The same method on every line, every shift.
  • Live figures, not a report a day later.
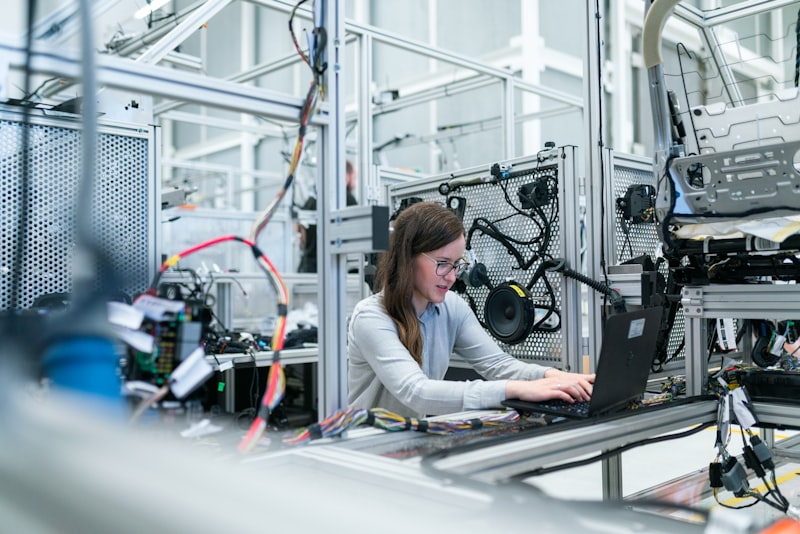
A machine on a production line feeding live data
Split Into Three

See whether the loss is Availability, Performance or Quality

A single OEE number tells you something is wrong, not what. Splitting it into Availability, Performance and Quality shows whether the machine is stopping, running slow, or making rejects, so the fix goes to the right place instead of a guess.

  • Availability, Performance and Quality shown side by side.
  • Per machine and per line, not one plant average.
  • A clear read of where the number is leaking.

Operator reviewing production performance figures
The Three Parts

OEE is Availability times Performance times Quality

The AI tracks each part on its own, so an OEE of 72% is never a mystery. Figures below are illustrative.

Availability
Uptime vs planned88%

How much of the planned time the machine was actually running. Lost to breakdowns, changeovers and waits for material or people.

Performance
Actual vs ideal speed91%

How fast it ran against the ideal cycle time. Lost to slow cycles, small stops and running below rated speed.

Quality
Good vs total parts90%

How many parts were good the first time. Lost to rejects, rework and scrap during start-up or steady running.

How It Works

From machine signals to a live OEE you can trust

1
Connect
We read run and stop signals, cycle counts and quality data from machines and your ERP.
2
Calculate
The AI works out Availability, Performance and Quality, and the overall OEE, in real time.
3
Show live
OEE appears per machine and line on a dashboard, current instead of a day old.
4
Pinpoint
Losses are grouped into downtime, slow cycles and rejects, then ranked by cost.
5
Improve
The team works the biggest loss first and watches OEE move toward the target.
What It Measures

Everything behind the OEE number

Not just the headline figure, but the losses that make it what it is.

🔢

Overall OEE

The headline figure per machine and line, calculated live from data, with a clear target to improve toward.

Availability

Uptime against planned time, with the downtime broken out by breakdown, changeover and waiting.

Performance

Actual speed against the ideal cycle, so slow running and small stops show up instead of hiding.

Quality

Good parts against total parts, with rejects, rework and scrap counted where they happen.

📉

Biggest losses

Downtime, slow cycles and rejects ranked by how much OEE each is costing, so effort goes where it pays.

🕑

Trend over time

OEE by shift, day and line, so you can see whether a change actually moved the number or not.

What Changes

What a live OEE view changes on the floor

Live
OEE instead of a day-old report
One
Number everyone agrees on
Clear
Split by Availability, Performance, Quality
Ranked
Losses ordered by what they cost
Less
Time spent on manual data entry
A target
To improve toward, week on week
Why Us

Why manufacturers choose TCB Infotech for OEE

1
We know the data
We build ERP and software, so we can read machine signals and ERP records and turn them into one clean OEE.
2
Floor first
We start with how your lines actually run, then measure, so the OEE reflects reality, not a template.
3
Honest measurement
Availability, Performance and Quality are defined clearly and the same way every shift, so no one games the number.
4
Model-agnostic AI
We pick the approach that fits your machines and budget, not a single vendor's tool.
5
Works with what you run
It sits alongside your ERP and machines and reads from them, so nothing has to be ripped out.
6
Proven delivery
50+ projects across industries, with zero failed projects since 2021.
FAQ

OEE Analytics questions

What is OEE Analytics?
OEE Analytics is AI that calculates OEE automatically from your machine and ERP data. It splits OEE into Availability, Performance and Quality, tracks it live per machine and line, and points to the biggest losses so you know where to improve.
How is OEE calculated?
OEE is Availability multiplied by Performance multiplied by Quality. Availability is uptime against planned time, Performance is actual speed against the ideal cycle, and Quality is good parts against total parts. The AI reads run and stop signals, cycle times and reject counts, so you do not fill this in by hand.
Do we still need manual OEE spreadsheets?
No. The point of this service is to end the manual spreadsheet. Data is read from machines and your ERP, so the OEE figure is current, consistent and the same for everyone, instead of being typed up a shift later.
What data does it need to work?
It uses machine signals such as run and stop states and cycle counts, plus ERP data such as the production plan and quality records. Where a machine has no controller output, a simple counter or manual entry point can feed the same model.
How does it find the biggest losses?
The AI groups lost time and lost output into downtime, slow cycles and rejects, then ranks them by how much OEE each one is costing. That way the team works on the loss with the largest payback first, not the loudest complaint.
Does this replace our ERP or MES?
No. It sits alongside them. It reads from your machines and existing systems and gives you a clear OEE view on top, so you get the measurement without ripping anything out.

See Your Real OEE, Live

Book a free consultation. We will look at your machines and ERP data and show you how OEE would be calculated automatically for your lines.

Book a Free Consultation →

No commitment. A practical first look at your OEE.