TCB Infotech | Expert Odoo & ERPNext Implementation Partner


What Is Inside an AI CEO Dashboard
The dashboard is built on your live systems, not on a monthly export. Here is what it connects to, what it shows each person, and how the AI layer turns movements into something you can act on.
From connected systems to a decision you can make today
One view built from every system you run
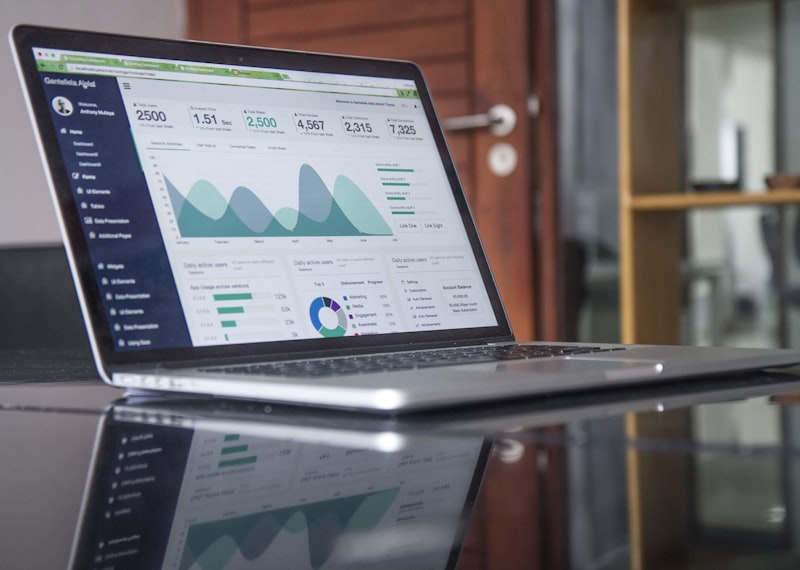
We connect your ERP, accounting software, CRM, production system and the spreadsheets that are still part of the process, then match customers, items and cost heads so a figure means the same thing wherever it came from.
- Direct connections to your live systems.
- Customer, item and cost data reconciled once.
- Every total drills back to its source record.
Each person sees the numbers that belong to them
The owner sees the full picture across sales, cash, margin and plant. A sales head sees pipeline, orders and collections for their region. Sensitive figures such as cash position, salary cost or customer-level margin stay with the people who should see them.
- Separate views for owner, finance, sales and operations.
- Access controlled figure by figure.
- The same underlying data behind every view.

It tells you what changed, and answers what you ask
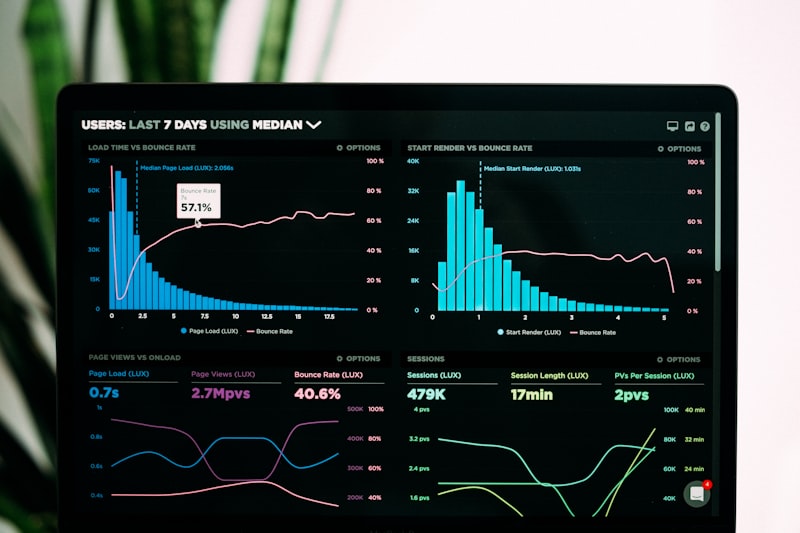
The AI watches your numbers for movements that matter, explains the likely reason with the supporting figures, and answers typed questions such as which customers slowed down this quarter. You decide what to do with the answer, and you can always see the records behind it.
- Exceptions brought to you instead of buried in a report.
- Plain-language answers with the source numbers attached.
- Model-agnostic, matched to your data and your rules.
Everything the dashboard delivers
Live KPI tiles
Sales, cash, order book, margin, stock and output on one screen, current to the last entry.
Exception alerts
Movements that need a decision are pushed to you, with the numbers that triggered them.
Drill-down to source
Open any total and see the invoices, orders or entries it was built from.
Ask in plain language
Type a business question and get an answer backed by the underlying figures.
Mobile and daily digest
The same view on your phone, plus a short morning summary of what moved.
Role-based access
Each person sees their own area, and confidential figures stay restricted.
See What Your Dashboard Would Show
Book a free consultation. We will look at your systems and the numbers you run on, and scope an AI CEO dashboard for your business.
Book a Free Consultation →